
Asking ‘Does solar make sense in Maryland?’ is a relatively simple question, but after being in the energy industry since 2002, we know the answer is anything but. Without defaulting to the cop-out of “it depends,” we use a distinct, transparent methodology to see if going solar actually makes sense for your property.
The simplest answer is that solar makes sense if it is cheaper than what you are paying your electric company. But how do we break that down accurately? The exact metric we use is the Levelized Cost of Energy (LCOE). LCOE allows you to evaluate the true financial viability of a solar project by comparing the fixed lifetime cost per kilowatt-hour of a solar system against the variable, escalating rate of the electric company.
1. Understand How You Are Charged Right Now
When evaluating if solar makes sense in Maryland, the first step is understanding your current utility cost. As a consumer of electricity in Maryland, you are charged for every unit of electricity you use, measured at your electric meter. The unit of energy measured is a kilowatt-hour (kWh). Your utility rate is actually a bundled combination of generation, transmission, and distribution charges, but these are all based on your electrical usage. To figure out your true energy expense, we need to figure out how much the electric company is charging you for every kilowatt-hour you consume.
Practical Example:
In 2025, the average price for one kilowatt-hour was 19.48 cents (about 12% higher than the national average) for Maryland homeowners. Therefore, for every kilowatt-hour the average Maryland homeowner consumes, they owe the electric company 19.48 cents.
- If a home uses 1,000 kilowatt-hours in one month, the energy bill is $194.80.
- If a home uses 2,000 kilowatt-hours in one month, the energy bill is $389.60.
Note: Commercial consumers have an additional, highly variable metric to factor in known as a Demand Charge, which measures the peak power drawn at any given time (measured in kW, rather than kWh).
Note: There is usually a small flat fee per month to stay connected to the grid, but these are around $10 and are omitted in this article for simplicity.
2. Determine Your Current Cost for Energy
Using a state average gives us a good head start, but since costs vary by utility, we prefer to get more granular. We stay on top of these local rate changes for you, but here is a quick shortcut you can use to find your exact price directly from your most recent bill.
How to Find it on Your Bill:
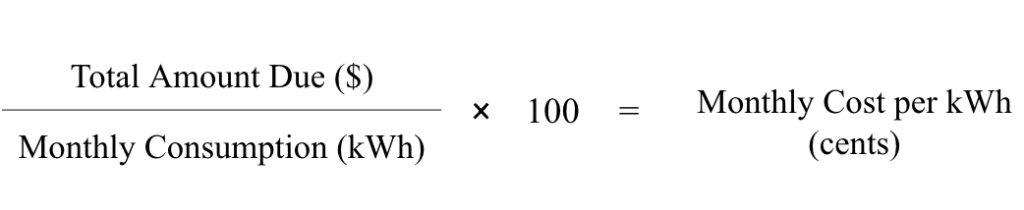
Take a recent electric bill and find your consumption for the month (measured in kilowatt-hours), which can usually be found on the first page. Next, find the Total Amount Due for that month (ensuring there are no past-due balances attached). Divide the Total Amount by the Consumption and the multiply by 100 to find your cost per kilowatt-hour in cents.
Practical Example:
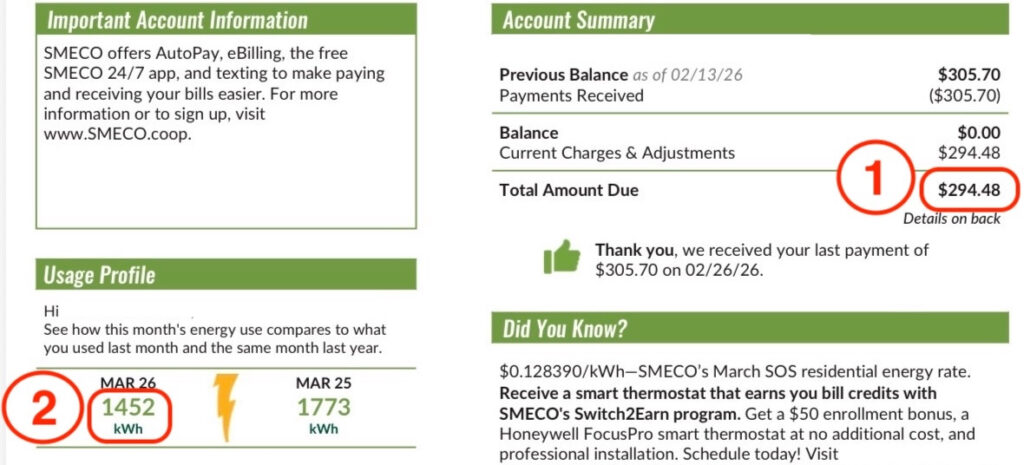
The customer above has an electric bill for $294.48 (1) and used 1,452 kilowatt-hours (2) that month. Dividing $294.48 by 1,452 kilowatt-hours gives us $0.2028 and then multiplying by 100 gives us 20.28 cents per kilowatt-hour. In plain terms: for every single kilowatt-hour this homeowner used, they were charged 20.28 cents.
This is a great shortcut, but keep in mind that the cost per kilowatt-hour varies monthly based on seasonal charges, charge adjustments, and administrative fees. In our proposals, we get super granular and run a rolling 12-month average to save you the headache and ensure statistical accuracy. Below are a few utilities we stay on top of:
| Utility: | SMECO | BGE | PEPCO | Potomac Edison |
| Cents per Kilowatt-hour:(2/1/2026) | 20.02 cents | 24.34 cents | 24.26 cents | 16.44 cents |
As you can see, most of these utilities have already far surpassed the 2025 Maryland average.
3. Determine the Cost of Energy with Solar (LCOE)
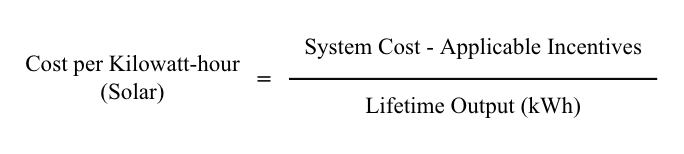
So, we know how much you pay the utility for electricity. What about with solar? This is when a professional solar design comes into play. To calculate your solar cost per kilowatt-hour, we need three primary inputs:
- Cost of the System: For cash purchases, we use the outright cost of the system. If you are taking out a loan, we factor in the total cost of capital (interest) to ensure total accuracy.
- Lifetime Output of the Solar System: Measured in kilowatt-hours, this requires a highly accurate generation model (usually spanning 30 years). A robust design accounts for exact azimuth, roof pitch, historical weather irradiance patterns, county or state setbacks, and hardware degradation. For instance, top-tier panels carry a 25-year performance warranty, meaning we can mathematically map exactly how much power they will produce decades from now.
- Not all solar designs are created equal. Simplified models often ignore critical factors like annual performance loss rates and shading obstructions, which can lead to inaccurate production targets. It is essential to ensure your designer accounts for every site variable. A good first step is to ask for a shade report or confirm the specific setback requirements used in the design.
- Applicable Incentives: Commercial and residential properties each qualify for their own unique tax credits and grant programs. While the exact incentives can vary based on your county, income level, or system size, they can significantly reduce the net cost of your project and are a crucial piece of the equation.
Once we have the inputs, the calculation is straightforward:
Putting It Into Practice: A Sample Solar Calculation
To see how this works in a real-world scenario, let’s walk through a sample system calculation. Suppose a residential project has a total system cost of $27,966. In this case, the homeowner qualifies for $5,313 in estimated Solar Renewable Energy Credits (SRECs). When we spread that net investment over a modeled 30-year lifetime production of 291,741 kilowatt-hours, we can find the levelized cost:
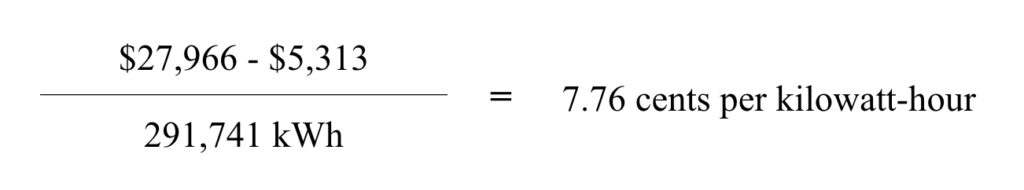
In this scenario, the homeowner has effectively “pre-bought” their electricity at a fixed rate of 7.76 cents per kilowatt-hour, a massive 60% reduction compared to the Maryland utility average of 19.48 cents.
4. Consider Future Energy Prices
Once you have calculated your current utility cost per kilowatt-hour and compared it against your solar cost per kilowatt-hour, the financial advantages often become clear immediately. However, looking only at a single snapshot in time doesn’t tell the whole story. While your solar cost per kilowatt-hour represents a locked-in, fixed rate for 30+ years, your utility rate is a moving target characterized by a continuous escalation rate. To perform a truly accurate analysis, we must extrapolate the future cost of energy from the grid.
Below is a historical breakdown of average residential electricity costs in Maryland, utilizing data provided by the United States Energy Information Administration (EIA):
| Year: | 2005 | 2015 | 2022 | 2024 | 2025 |
| Average Cost per Kilowatt-hour | 8.46 cents | 13.82 cents | 14.46 cents | 17.86 cents | 19.48 cents |
At Energy Select, we map these data points to identify both long-term and short-term trends. Unsurprisingly, the trajectory is aggressively upward, but the rate of acceleration is what demands attention:
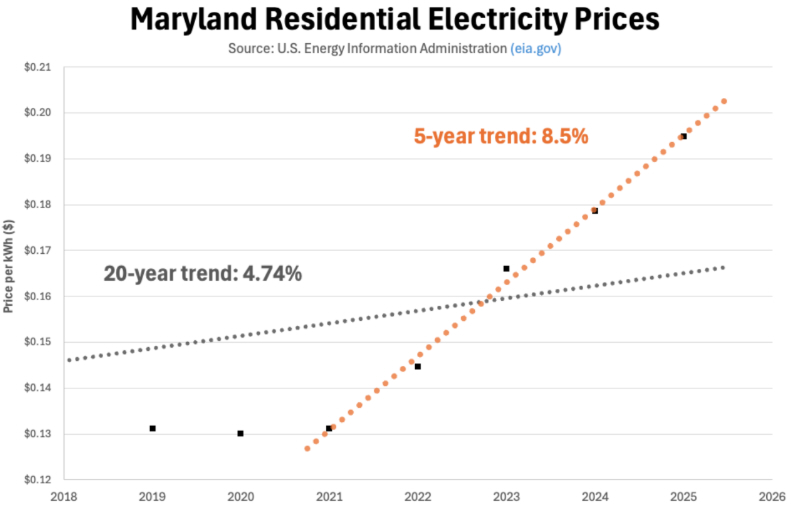
Key Takeaways:
Long-Term Trend:
Over the last 20 years, utility rates in Maryland have increased by an average of 4.74% annually.
Recent Acceleration:
From 2021 to 2025, the 5-year trend spiked to a staggering 8.5% annual increase, nearly double the historical average.
Historical Growth:
Since 2005, the cost per kilowatt-hour has risen from roughly 8.46 cents to 19.48 cents, representing a 130% increase in just two decades.
Pressures on the Grid
Why are prices escalating so rapidly? Looking ahead, the regional grid infrastructure is facing unprecedented strain from several convergent factors:
- Data Center Expansion: U.S. data center power consumption is projected to roughly triple by 2030.
- Electrification of Transport: Demand for electricity from electric vehicles is forecasted to surge by 1,400% to 1,600% within the same timeframe.
- Infrastructure Costs: In response to these demands, regional grid operators have already increased capacity charges by 833% for the 2025/2026 delivery year.
These massive wholesale infrastructure costs are ultimately passed directly to the ratepayer. While we do believe rates will increase at a rate much higher than the past, we utilize the 20-year average of 4.74% in our modeling. We consider this a conservative baseline for calculating the long-term ROI of a solar investment.
To bridge the gap between historical data and your specific financial future, we built the Utility Cost Projection tool below. While Step 2 provided a current “snapshot” of your utility costs, a true analysis must account for the continuous escalation rate of electricity purchased from the grid. This tool calculates the average of your electricity costs over 10, 20, and 30 years, factoring in the compounding effect of annual rate hikes.
To use this tool effectively, input your current cost per kilowatt-hour, calculated from your most recent bill, and the annual escalation rate. We recommend using the conservative 20-year Maryland average of 4.74% for a stable projection, but feel free to adjust higher or lower as needed.
Utility Cost Projection
See your average utility rate over time in today’s currency.
10-Year Average
20-Year Average
30-Year Average
Example: The Compounding Effect
Let’s look at the financial impact for an average Maryland resident starting at 19.48 cents per kilowatt-hour with a 4.74% annual increase:
- 10-Year Average: 24.2 cents per kilowatt-hour
- 20-Year Average: 31.3 cents per kilowatt-hour
- 30-Year Average: 41.3 cents per kilowatt-hour
When you compare your fixed solar cost per kilowatt-hour (like the 7.76 cents from our previous example) to electric company’s cost per kilowatt-hour, you shouldn’t just compare it to today’s price of 19.48 cents. You must compare it to the 30-year projected average of 41.3 cents.
Conclusion
Ultimately, the only way to truly determine if solar makes sense in Maryland is to perform a direct comparison between the total amount you will pay to continue buying power from the utility, including future rates, versus the costs associated with generating your own power through solar.
We believe that the transition to solar should be based on transparent data, not guesswork. Our primary objective is to provide you with a fixed, predictable energy rate that insulates your property from the volatile surges and infrastructure charges of the utility grid.
Let us do all these calculations for you and specific to your property. We offer a comprehensive free consultation, during which our team handles all the heavy lifting, from design modeling to calculating every applicable incentive, to deliver a definitive LCOE analysis tailored specifically to your property. Reach out to us today to see exactly how the numbers work for your future.